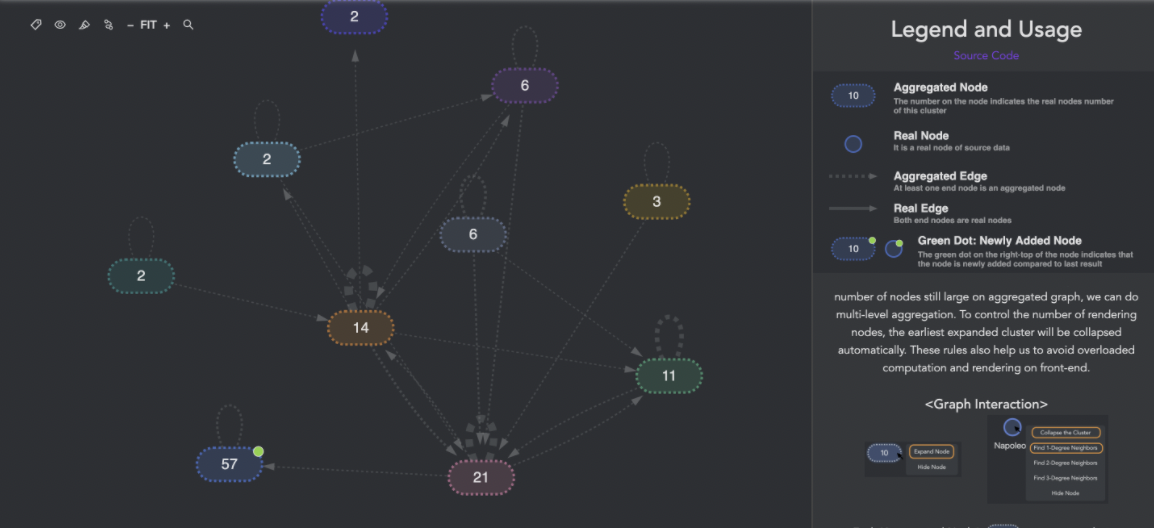
G6 large clustered graph
https://g6.antv.vision/en/largegraph How could a graph database structure be visualized and perceived by end users in a more helpful way than a large graph
Notice how it creates clusters that show the number of items within that cluster as a ZUI
